Glass ball reflecting light from sun and river in green landscape

Life Cycle Assessments for the Climate – A tool for the circular economy

Life Cycle Assessments for the Climate
– A tool for the future of the circular economy

Life cycle assessments, commonly known as LCAs, go beyond classical approaches to assessing environmental consequences of products, industries, and company actions. LCAs provide companies a more in depth understanding of the impacts they have on the environment by accounting for more stages than just the use stage.

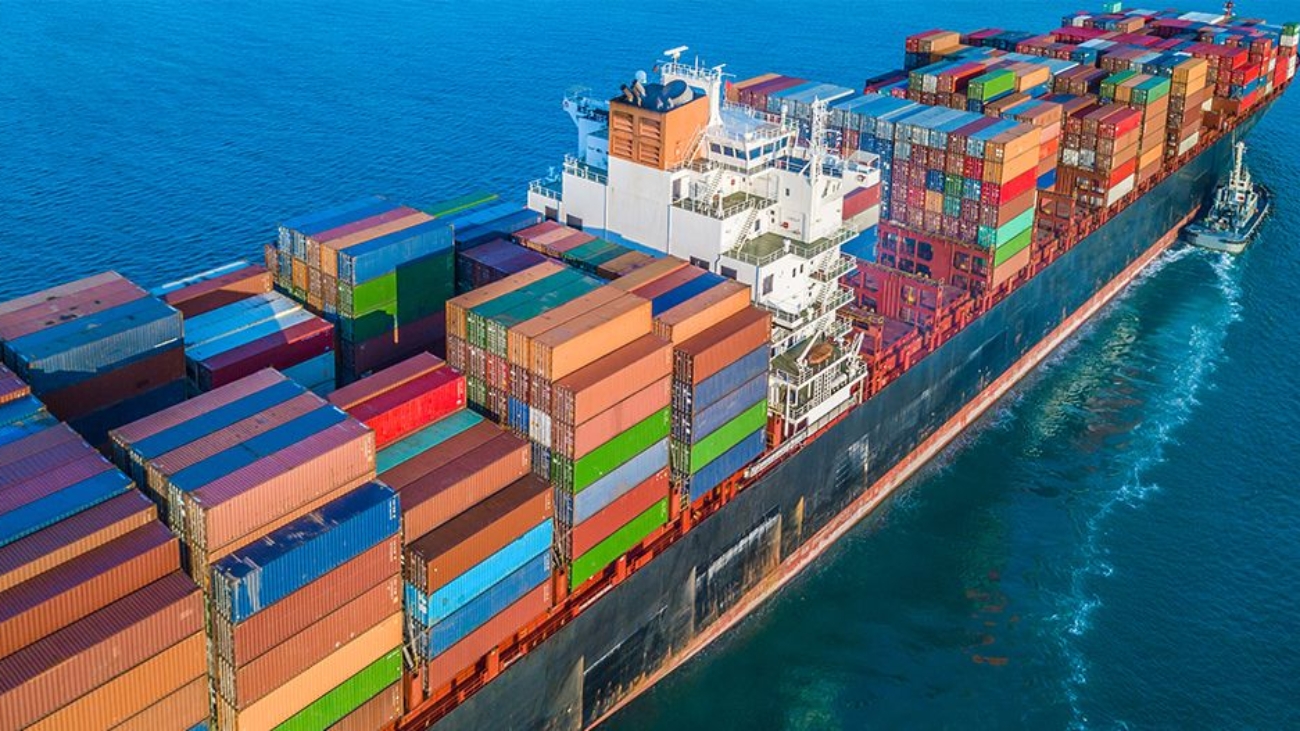
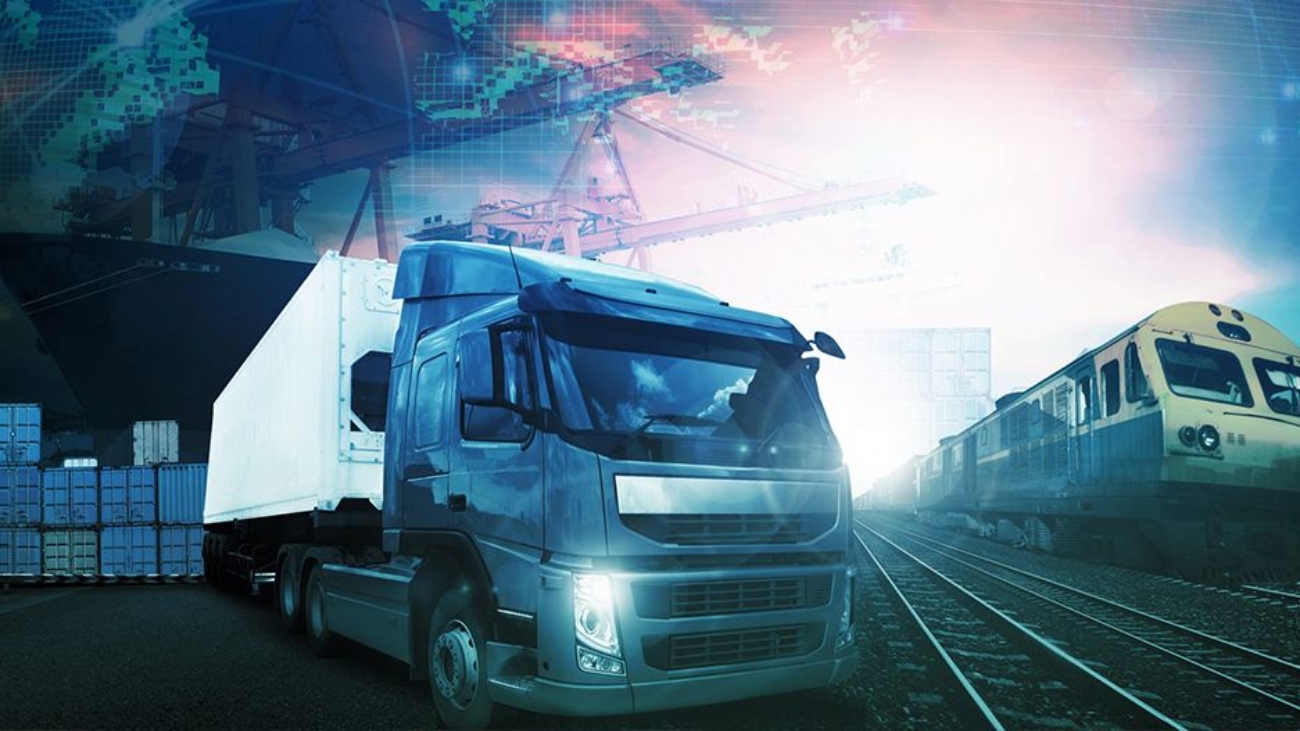
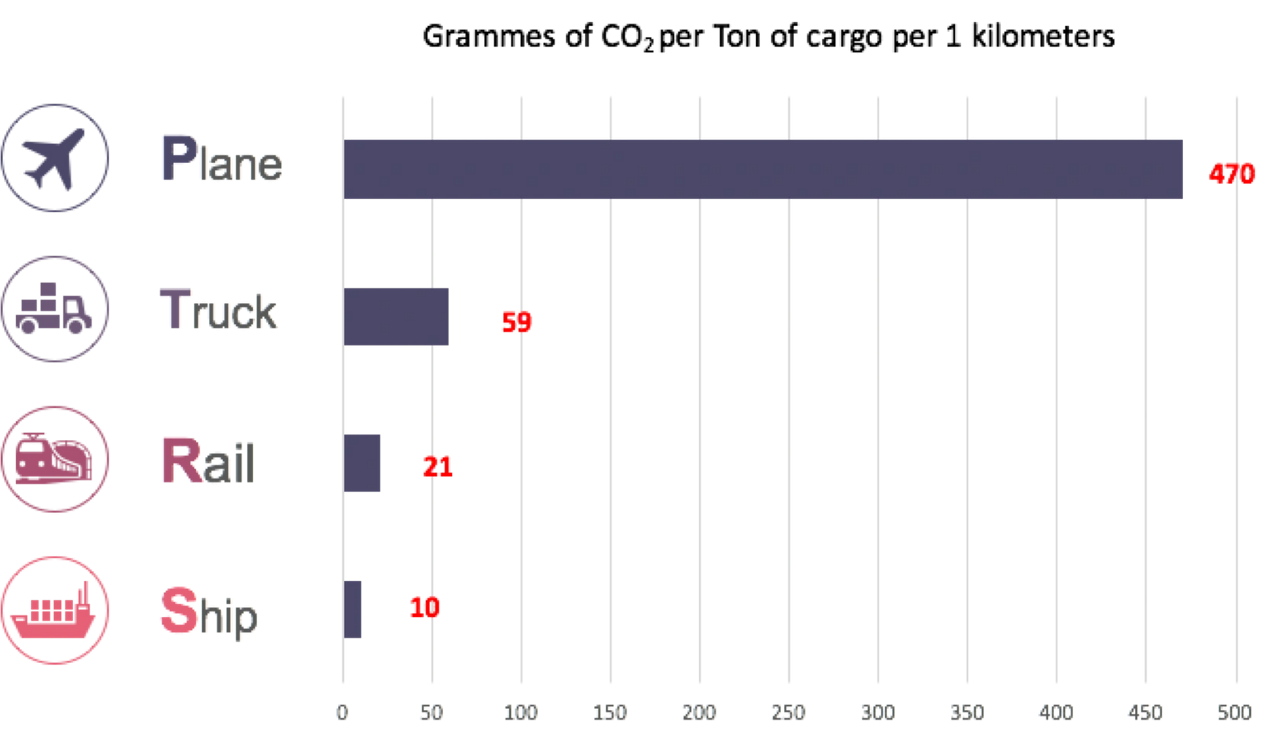
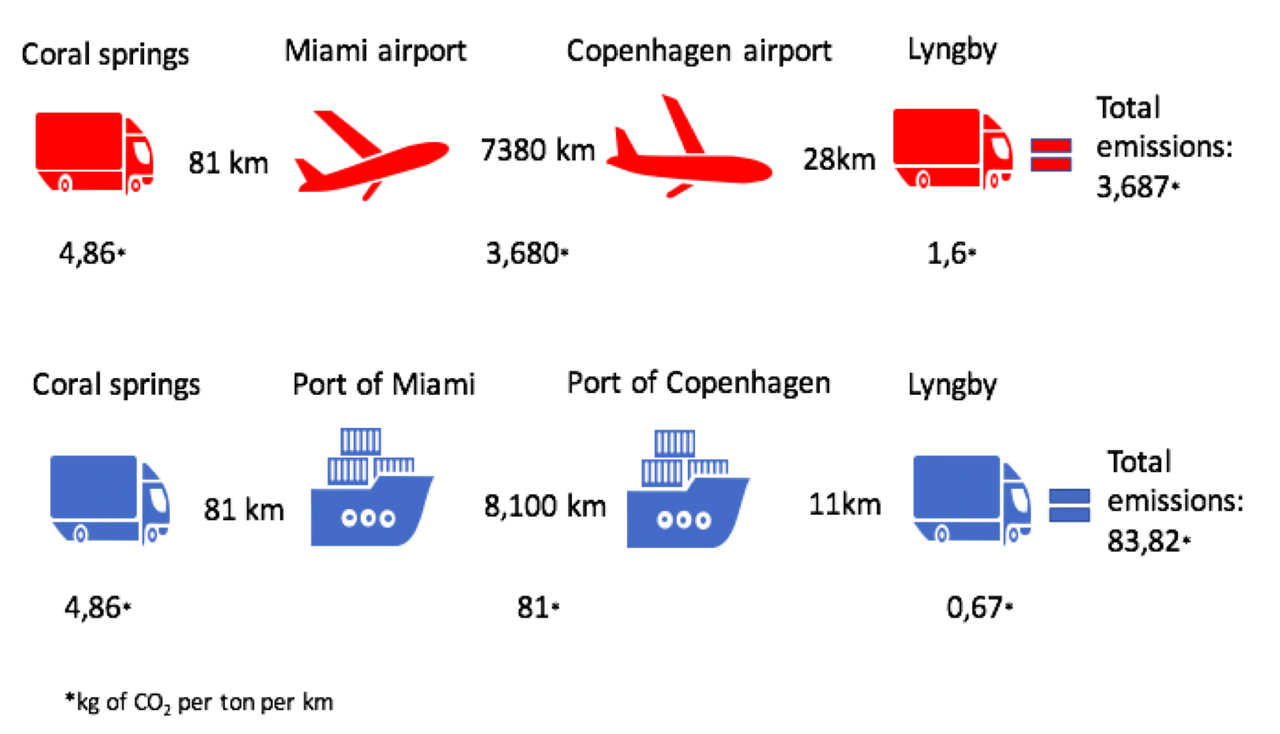
Taking the emissions released from the distribution stage, for instance, is also important to consider when accurately calculating your overall emissions. Think of a truck with heavy cargo on its way to a warehouse or factory – emissions are created during this necessary process of transporting a product or getting it to its final destination. This is the case with all the stages within a life cycle assessment.

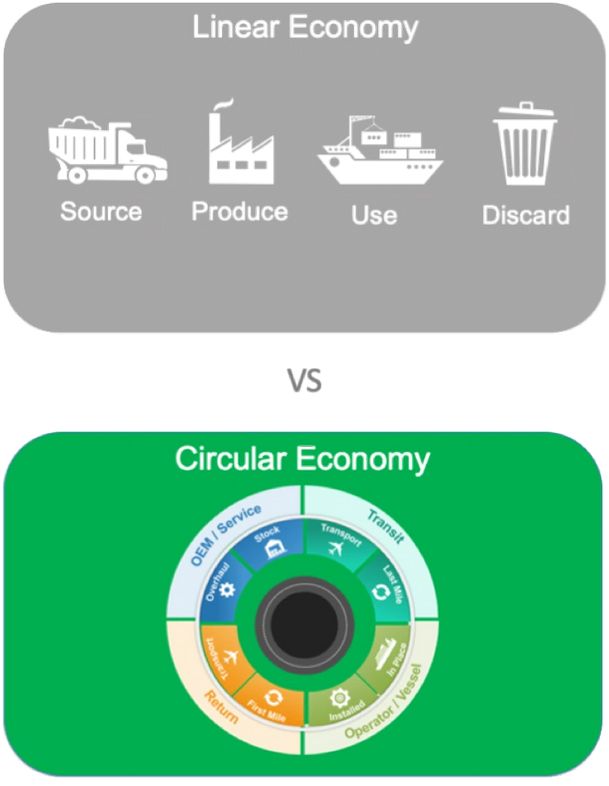
The Circular Economy

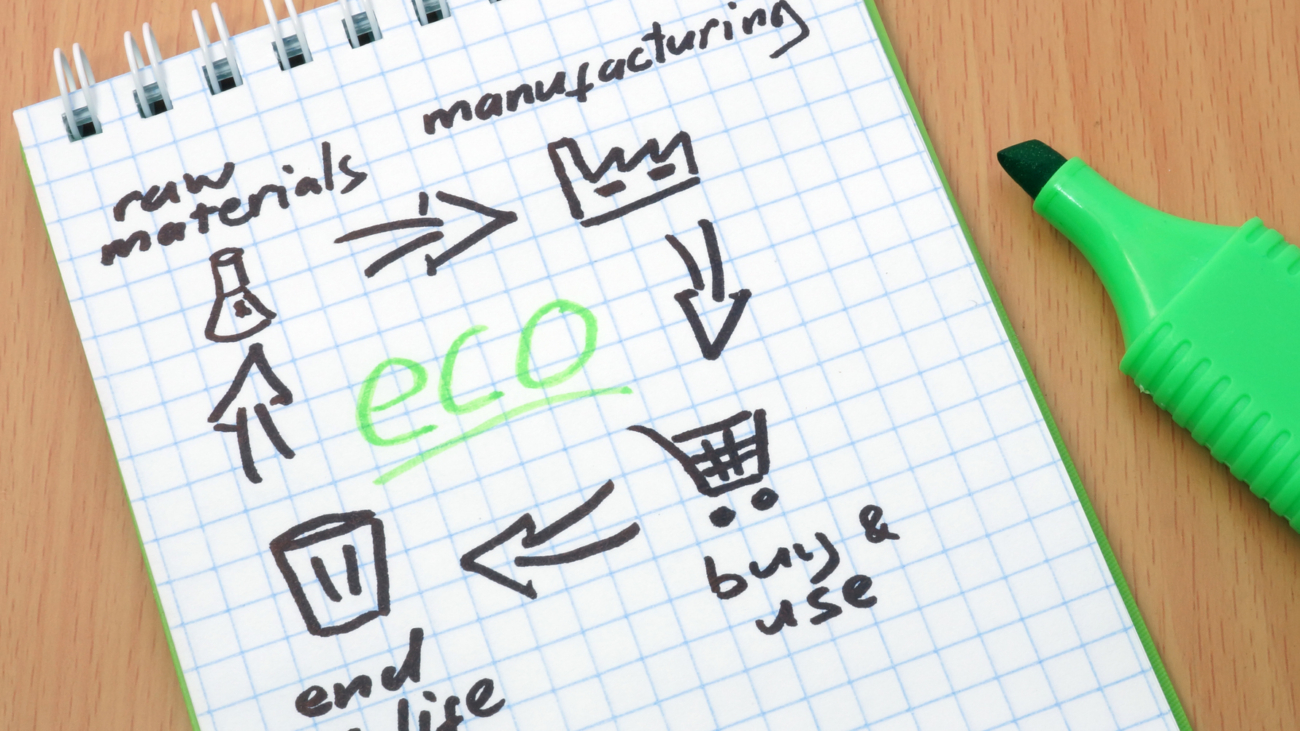
A circular economy goes beyond the typical buy, sell, and dispose mentality. This closed loop thinking incorporates holistic and environmentally preferable solutions to a products’ life cycle, often by factoring in stages like reuse and recycling.

An LCA tool or a carbon footprint calculator is a good instrument which can be utilized to understand the most optimal ways for a product to best engage within the EU circular economy and become environmentally preferable products.

Cradle-to-Cradle & Cradle-to-Grave

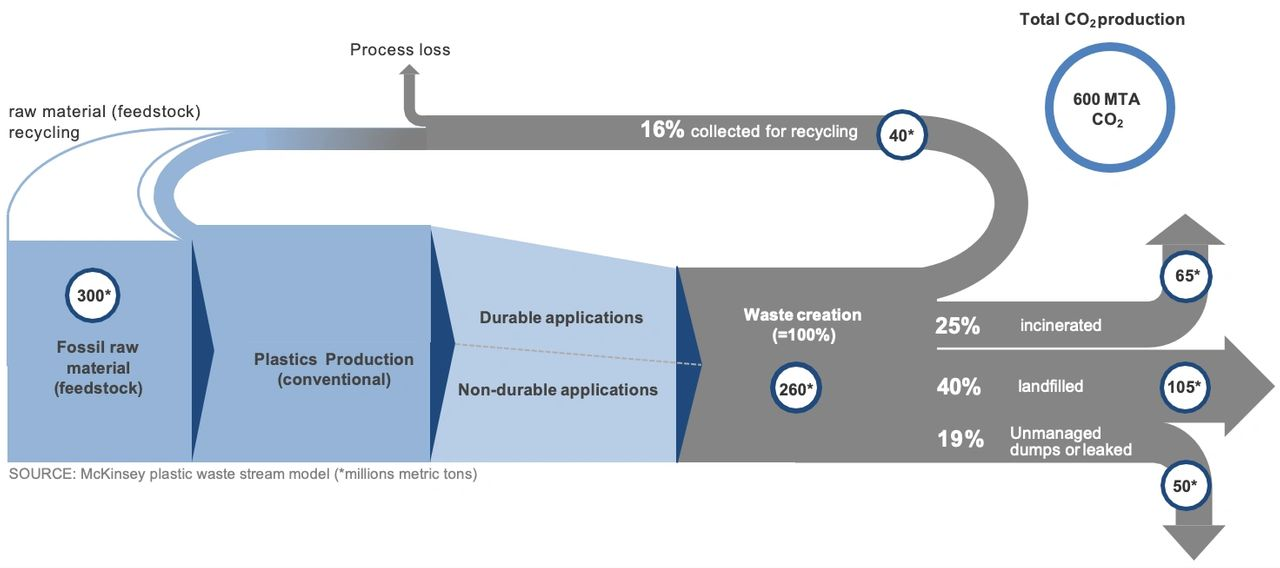
Conducting an LCA on the granular level starts from the point of extracting the raw materials all the way up until the complete and eventual disposal of a product. This is commonly known as cradle-to-grave which is where the life cycle assessment gets its name. Cradle-to-grave refers to all of the stages the product experiences up until the point of which it is disposed of or no longer being used. However, incorporating additional stages such as recycling and refurbishment, adds a cradle-to-cradle concept which becomes necessary when engaging in a circular economy.

Other steps such as what occurs during resource processing, manufacturing, recycling, and disposal are also taken into account when calculating overall environmental impacts. Cradle-to-cradle provides a more holistic approach to life cycle analysis and incorporates circular thinking. With cradle-to-cradle, a products’ creation as well as its disposal and even actions beyond like recycling and repurposing as included. This is important because LCAs can aid in pinpointing hotspots where environmental impacts are greatest in a products life which, often as not, is not always the use stage.

Oftentimes the greatest environmental impact from a product can be found within the manufacturing or disposal stage where unfavorable methods are used and materials go to waste or where disposing of a product demands extensive steps to ensure safety to the public.

Two colleagues working on project

Carbon Footprint & Environmentally Preferable Products (EPP)

The carbon footprint is generally defined as the calculated output of Carbon dioxide and equivalents (CO2e) from any and all activities–anything from driving a car, to charging your phone, and even your new purchases.

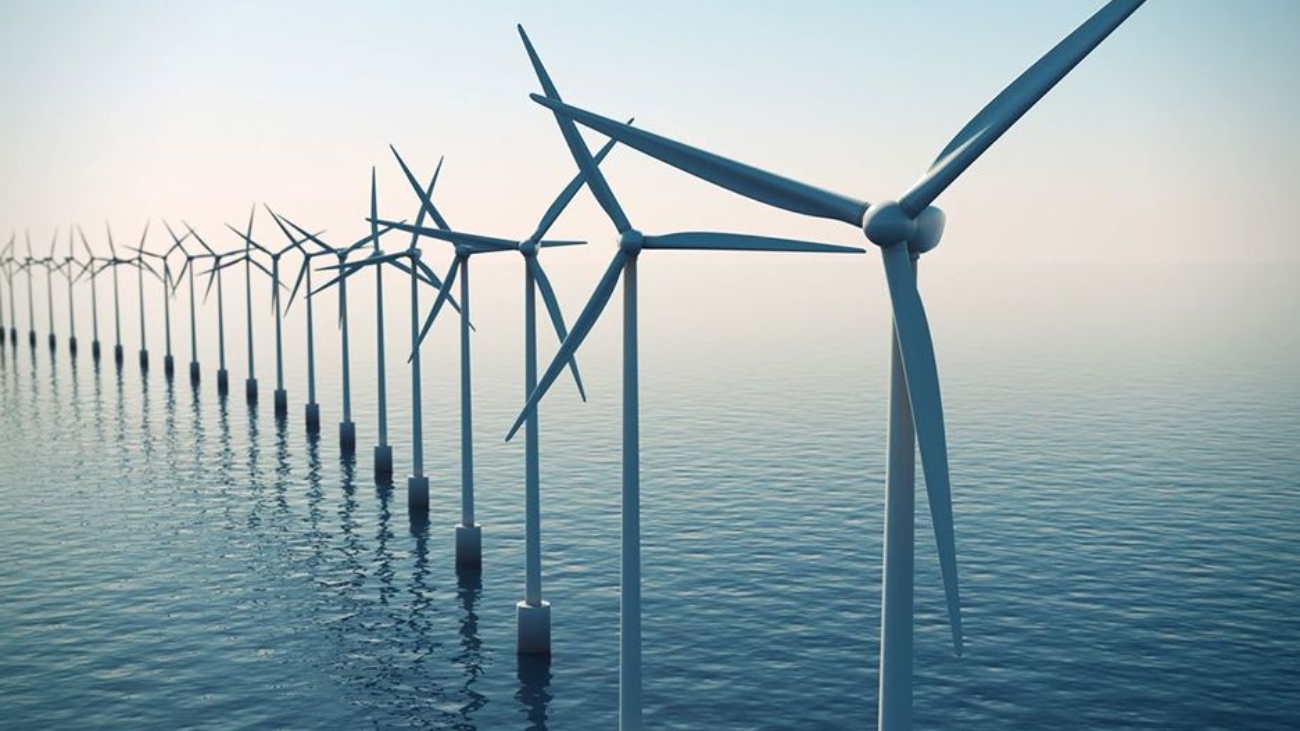
Environmentally preferable products (EPP) or Sustainable Products (SP) take this carbon footprint into consideration and are generally defined as products and services that have a lesser or reduced effect on human health and the environment when compared to competing products or services that serve the same purpose.

The carbon footprint of products or activities can be calculated using a carbon footprint calculator where the results represent the quantity of CO2e emissions released into the atmosphere, thereby making it easier to assess products or activities on an environmental level.

Examples of environmentally preferable products can include:

  • Reduced packaging
  • Ease of reuse, refurbishment, remanufacture or recycling at end of life
  • Reduction of emissions and air contaminants
  • Improved energy and water efficiency
  • Use of alternative sources of energy and fuels
  • Reduced waste, and practices that support reuse and recycling
  • Use of renewable resources
  • Reduced exposure to toxins and hazardous substances
  • Greenwashing

    Greenwashing refers to when companies and organizations mislead their consumers or audiences by making them believe that a product, service they provide, or the organization itself is environmentally friendly or sustainable, when it is not. Deceptive claims that refer to products as environmentally friendly when important factors essential in accurately calculating the carbon footprint of the product are neglected often constitute greenwashing throughout many industries.

    So how do you avoid greenwashing?

    Being transparent on your calculations and method is one of your most powerful tools in avoiding claims of greenwashing. This means sharing how you perform your calculations and sharing your results with your value chain and the public.

    The Makeup of Life Cycle Assessments

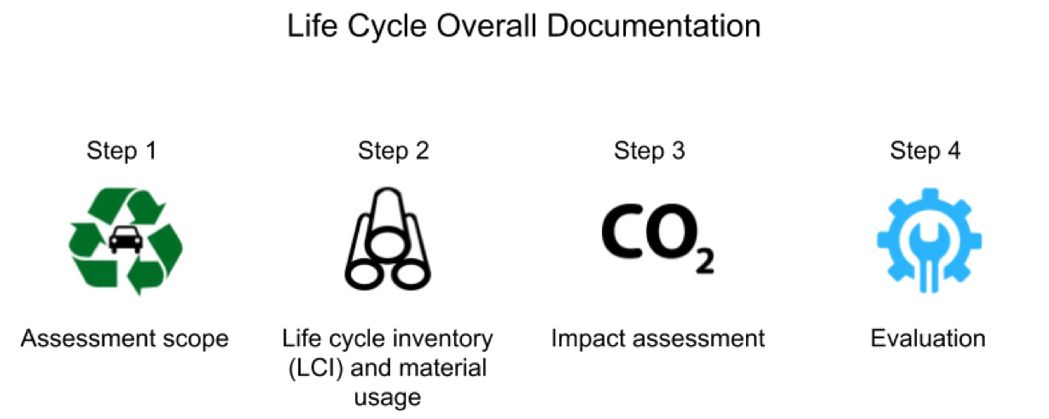
    According to ISO 14040 and ISO 14044 – the leading standards for LCAs – an LCA is performed in four main phases or steps:

    • The first step in completing an LCA requires conducting an evaluation of what the goal and scope are, including a detailed definition of the product, its life cycle stages and modeling choices.
    • The next step involves taking inventory and listing all inputs (e.g. materials, energy) and outputs (e.g. waste) in each of the life cycle stages of the product. A good source of the product inputs is the bill of materials, which will often include information such as what kinds of raw materials can be found within the product and specifications of the composition like the specific weight, or mass of a component. This ensures that all the components required for assessing the product can be individually assessed and the products overall environmental footprint can be thoroughly documented. If not readily available, the bill of materials can often be easily compiled by engaging upstream suppliers. 
    • As the third step, an impact assessment is made to best understand where hotspots, or the points which demand more attention, are occuring.
    • Finally, following this step an improvement assessment can be made which provides a detailed analysis of the findings following completion of the LCA and often recommendations as to further improve the product or components environmental impact.
    • All in all, LCAs are a powerful tool in that they can help empower decision makers to engage in different methods and facilitate strategies that allow them to incorporate granular environmental thinking into their products.

      notepad with product life cycle and word eco. Recycling

      Carbon Footprint Accounting? Here’s what you need to know

      Carbon footprint accounting? Here's what you need to know

      Life cycle thinking in carbon footprint accounting

      Activity-based approach and spend-based approach are two common Greenhouse Gas (GHG) accounting (commonly known as carbon footprint accounting) methods. While both are compatible with life cycle thinking, they differ greatly in the origins of inventory data and emission factors. Distinct origins and characteristics of the data used in these two approaches lead to significant differences in the data collection process, resulting in GHG inventories with varying levels of details, specificity, representativeness, and accuracy, and accordingly the applicability of the accounting results to decision making for corporates, consumers, and regulators.

      Inventory: technical-physical data vs. financial data

      The activity-based approach necessitates engineering process data of the processes managed by the reporting company as well as its suppliers and service providers, e.g. Bill of Materials. The collected data are in physical units such as kilograms and kWh. They are principally process-specific primary data supplemented by secondary market average data. The data collection process usually takes time and effort, however, it yields detailed, representative, and consistent results.

      Differently, the spend-based approach requires exclusively financial data or purchases, and values are expressed in monetary units. Data from suppliers or service providers is not needed, thus reducing the time and resources for the inventory data curation process. However, financial data are subject to price fluctuations caused by varying exchange rates, changing market conditions, as well as other temporal and geographical factors. For instance, the same product bought in different purchasing conditions may have distinct GHG footprints, while the factual GHG emissions should remain the same. These complicate the spend-based approach and add great uncertainties not only to the financial inventories but also the GHG accounting results.

      In this video we discuss and explain the differences between Spend based and Activity based approaches

      Application: credible and consistent accounting vs. screening

      The accounting results developed based on the activity-based approach provide a good representation of the reporting company’s specific value chain activities. The accounting allows the reporting companies to conduct baseline setting and identify key contributors and accordingly develop emission reduction plans. Given the consistency and credibility of the primary data and high-resolution emission factors, the obtained accounting results can be used to track progress of the reporting companies towards reduction targets. 

      The spend-based method can be a helpful tool for corporates to approximate organizational or product-level footprints during the initial screening phase of the climate combat journey. However, given the lack of specificity and consistency in the inventory data and low-resolution emission factors, GHG accounting based on the spend-based method is not recommended to be used for reporting or monitoring. 


      References

      GHGP. (2011). Corporate Value Chain (Scope 3) Standard | Greenhouse Gas Protocol. https://ghgprotocol.org/standards/scope-3-standard 

      ISO. (2018). ISO 14064-1:2018 Greenhouse gases—Part 1: Specification with guidance at the organization level for quantification and reporting of greenhouse gas emissions and removals. ISO. https://www.iso.org/cms/render/live/en/sites/isoorg/contents/data/standard/06/64/66453.html 

      unt11-d3e64d50

      More to Sustainability?

      Is there more to sustainability?

      Sustainability is one of the new mega trends in the maritime industry. The industry has for many years avoided the focus of the consumer – that has now changed. A recent report from Unilever shows that a third of the consumers would prefer sustainable brands.

      This leads to the question – What is sustainability? We often talk about sustainability in an environmental context. In 2005 the World Summit on Social Development identified three main pillers of sustainability. Sustainability focuses on meeting the needs of the present without compromising the ability of future generations to meet their needs. The investment and banking corporation ING predicts in it’s recent sector analysis that future investors in maritime industry are more likely to invest in shipping companies with sustainable initiatives.

      Three pillars of sustainability

      Economic Sustainability

      This refers to practices that support long-term economic growth without negatively impacting social, environmental, and cultural aspects of the community.

      Social Sustainability

      The ability of a community to develop processes and structures which not only meet the needs of its current members but also support the ability of future generations to maintain a healthy community.

      Environmental Sustainability

      This refers to harvesting renewable resources that can be continued indefinitely, minimizing pollution creation, and avoiding non-renewable resource depletion.

      Source: European Union 2018

      Where are we heading?

      One of the core factors on why economic sustainability projects fails is the fundamental notion that you are often rewarded in doing something bad for the environment. An example: a shipowner is rewarded by using high-sulfur compared to the more expensive and “greener” low-sulfur alternative. The latest initiative from IMO with the 0,5% sulfur cap by 2020 – is a clear game changer for the maritime industry. Here the international regulatory institution leveled out the playing field- rewarding early adaptors and innovators.

      The process of regulating vessel emissions is reaching a mature stage – where are regulators looking next ? One can only guess! One of the areas missing attention is vessel maintenance – one could ague that a greener profile of a vessel should be defined is a larger context including the maintenance, spare-parts, logistics and crewing.
      12346-f39c5412

      Maritime sustainability: Are we doing enough?

      Maritime Sustainability: Are we doing enough?

       
      In April last year, IMO’s Marine Environment Protection Committee (MEPC) 72nd session took place in London. The initial strategy was representing a framework for the member states where one of the topics was reducing the GreenHouse Gas (GHG) emissions with 50% by 2050. The climate change strategy was made in line with the Paris climate change agreement that was agreed in the French capital in December 2015, in which 195 countries agreed to work to keep average temperature rises below 2°C to prevent dangerous climate change.
       
      But what has already been done or can be done with the current technologies? Even though the goal is 50% by 2050, a report published by the International Transport Forum (ITF) ahead of the IMO strategy announcement found that the industry could achieve up to 95% decarbonization as early as 2035 through the ‘maximum deployment of currently known technologies.’ So, the technology is already there, it is important that shipping lines and maritime suppliers begin to prioritize the implementation of a circular economy. According to an article by Ship Technology from June 2018, environmental organizations argue that shipping companies begin now to cut emissions. It is also argued that retrofitting existing ships with zero-carbon technologies and finding alternative fuel sources will be key, as new greener ship designs will take time to emerge.
      IMO MPEC 72nd session
      But what has already been done or can be done with the current technologies? Even though the goal is 50% by 2050, a report published by the International Transport Forum (ITF) ahead of the IMO strategy announcement found that the industry could achieve up to 95% decarbonization as early as 2035 through the ‘maximum deployment of currently known technologies.’ So, the technology is already there, it is important that shipping lines and maritime suppliers begin to prioritize the implementation of a circular economy. According to an article by Ship Technology from June 2018, environmental organizations argue that shipping companies begin now to cut emissions. It is also argued that retrofitting existing ships with zero-carbon technologies and finding alternative fuel sources will be key, as new greener ship designs will take time to emerge.

      However, there are also other options available when it comes to the circular economy. One option is a cross-industry collaboration where players from different industries use the same approach to address the issue together. Furthermore, cross-supply chain collaboration makes it easier to identify the areas where the maritime industry can save money and resources and in the end contribute to decarbonization and circular economy.

      The aviation industry is one of the front-runners when it comes to the circular economy. One of the methods they are working with is leasing where manufacturers lease out parts to the airlines. An example of this could be manufacturers that lease their turbines and takes care of the maintenance. This method does not only save the airline time and money but also contributes substantially to the circular economy because the manufacturer also takes care of reusing the whole material in the end.

      Several airlines are currently testing the use of Biofuels & have implemented extensive use of circular economy for aircraft maintenance

      The aviation industry can also be used for inspiration when implementing a circular economy because it is one of those industries that are good at recycling. According to an article from November 2018 by “the balance small business”, currently, 80-85 percent of an aircraft is recycled which was less than 50 percent only a few years ago. AFRA (The Aircraft Fleet Recycling Association) aimed at increasing this number to 90 percent by the end of 2016.

      A final and important question is whether or not it is only the shipping lines or also other stakeholders that must contribute in order to reduce GHG emissions. The answer is that shipbuilders, equipment manufacturers, insurers, bankers, and investors in shipping companies and ports are just as responsible for contributing to the reduction of GHG emissions. It is a joint collaboration and according to an article in May last year by ICTSD (International Centre for Trade and Sustainable Development) there are many among of the above-mentioned stakeholders who are already advocates of action to mitigate climate change.

      So, there is a general consensus in the maritime industry when it comes to implementing a circular economy and decreasing decarbonization. The methods and technologies are already available and a lot of inspiration can be found in the aviation business. Therefore, it is debatable if the goal of reducing GHG emissions by 50% by 2050 is ambitious enough – and if the maritime industry could reach this goal even earlier.

      About the author
      ReFlow Maritime is based in Copenhagen, Denmark and offers consultancy and digital services on sustainability and circular economy to maritime stakeholders.

      For more information: www.re-flow.io

      ezgif-2-cc1a866ff3d2-883fd1ed

      Circular Economy: a route towards a better environment

      Circular economy: A route towards a better environment

      The world population is growing and this is affecting the environment. Therefore, we need to switch from a linear to a circular economy. That is why several governments around the world, the Danish one among others, have developed a strategy for a circular economy. The aim is to ensure healthy and safe working conditions and cause less harm to the environment which a linear economy does.

      Source: re-flow.io
      Let’s take a closer look at the differences between a linear and circular economy.

      The linear economy has been the standard for many years and basically means that raw materials are used to make a product, and after its use, any waste (e.g. packaging and the used product) is thrown away.

      In an economy based on recycling, materials are reused. For example, waste glass is used to make new glass products like bottles and waste paper is used to make new paper. To ensure that in the future there are enough raw materials for food, shelter, heating, and other necessities, our economy must become circular. That means preventing waste by making products and materials more efficiently and reusing them. If new raw materials are needed, they must be obtained sustainably so that the natural and human environment is not damaged.

      The process is almost the same in the maritime industry. Here, parts from the ship are continuously refurbished or maintained by a service provider until the end of its life span.

      When that happens the part is sent back to the parts manufacturer where it will be recycled and the material will be used to create a new part.

      butes a lot to the CO2 production.

      8 million of the 260 million tons of plastic waste ends up in the sea, killing wildlife and disrupting ecosystems. 2% of this found in the US and Europe, 82% in Asia, and 16% in the rest of the world according to a 2019 report by McKinsey. According to the International Maritime Organization (IMO), in 2050 the number of plastics in the oceans will outweigh fish. So, the problem is very real and we need to act now before the plastic waste in the oceans reaches levels so high that it will become almost impossible to solve the problem within a foreseeable future.

      UN SDG number 12
      The availability of non-renewable raw materials is limited and acquiring them costs a lot of energy, so the recycling of used materials back to the beginning of the manufacturing process is extremely rewarding – the product cycle thus closes, minimizing waste. This circular economy pursues the vision of “zero waste” production. However, it is not enough to simply recycle the materials after they have been used – products must be designed for durability, easy repair, and the replacement of components from the outset.
       

      A circular economy in the automotive industry

      One of the industries that have successfully used circular economy for years is the automotive industry. The materials used are usually properly disposed of which provides a high degree of recycling potential. One of the car manufacturers that has had great success with circular economy is Daimler. In its “Life Cycle Overview” for current car models since 2009 they make it clear how the circular economy can be addressed in production from the outset – with the help of analyses of the entire product life cycle.
       

      Design for environment and Life Cycle Overall Documentation

      Under the guideline ‘Design for Environment’ (DfE), vehicles are designed during the early development stage in such a way that they are as resource-friendly and eco-friendly as possible in terms of CO2 consumption, pollutants, and waste materials. Corrections and adjustments at later stages are very expensive, so the cross-functional DfE team works together on the areas of eco-balancing, disassembly, recycling, material and process technology, design and production.

      In its Life Cycle Overall Documentation, Daimler follows four steps:

      1. Assessment scope: Here the objective and scope of an LCA (Life Cycle Assessment) are set for the entire life cycle.
      2. Life cycle inventory (LCI) and material usage: In the differentiated LCA, material and energy flow during all stages of the life cycle are analyzed based on questions such as how many kilograms of raw material flow in? How much energy is consumed? Which waste and emissions are generated? To optimize the material flows and return them to the circuit again, the individual components are mostly made of pure substances and are therefore recyclable.
      3. Impact assessment: This assesses the potential effects the product has on the environment such as global warming potential, summer smog potential, acidification potential, and other effects.
      4. Evaluation: Conclusions are drawn and recommendations are made for the optimization and production of subsequent models.
      UN SDG number 12

      Their results
      The results of the LCA are used as the basis for creating the product design and a recycling concept. For the Mercedes-Benz E-Class, which is one of Daimler’s car models, the recycling concept was developed parallel to the development of the vehicle by analyzing the individual components or materials for each stage of the process. The recycling or recycling rate of the entire vehicle is therefore 85 per cent for material recyclability and 95 per cent for recyclability. These high recycling rates can also be applied to the maritime industry and thereby potentially create the same results.

      So…
      To sum it up, it is evident that we need to switch from a linear to a circular economy if we want to stop polluting the environment and create a sustainable world. If we continue with a linear economy we will have used up all of the world’s natural resources within a foreseeable future and at the same time destroyed the environment. The maritime industry will also benefit a lot from implementing a circular economy because it will minimize waste and thereby decrease pollution to a minimum and also save shipping companies a lot of money. A lot of methods and best practices within a circular economy have already been implemented with great success in other industries. One of these industries is the automotive one, and especially Daimler has been able to recycle 85 per cent of the materials on one of their specific car models. The best practices and learnings from the automotive industry can also be used in the maritime industry where the same results could be achieved.

      For more information: www.re-flow.io

      thomas-millot-q5jKHtV4hWc-unsplash-1-1-scaled-b9100dc5123-26dfb532

      Should the next generation of ships sail on plastic oceans?

      Should the next generation of ships sail on plastic oceans?

      Plastic waste has become a huge concern globally and the consequences are damaging. Human beings are throwing away more than half their own weight in plastic every year – 260 million tons globally to be exact. The figure will probably reach 500 million tons by 2030 which is more than doubling in 11 years.

      The only bad news is not that we are throwing away 260 million tons of plastic every year, but that it is only 16% of this amount that is recycled. The remaining amount is being either incinerated, landfilled, or dumped or leaked which is, of course, damaging the environment and contributes a lot to the CO2 production.

      8 million of the 260 million tons of plastic waste ends up in the sea, killing wildlife and disrupting ecosystems. 2% of this found in the US and Europe, 82% in Asia, and 16% in the rest of the world according to a 2019 report by McKinsey. According to the International Maritime Organization (IMO), in 2050 the number of plastics in the oceans will outweigh fish. So, the problem is very real and we need to act now before the plastic waste in the oceans reaches levels so high that it will become almost impossible to solve the problem within a foreseeable future.

      The global flow of plastic 2016 (source: McKinsey)

      In Denmark, we also see the harm that waste plastics can cause at first hand. On its western coastline alone, 1,000 tons of waste is collected, but luckily 99% of Danes say it is important to act on the challenge of plastics in nature. So, there is a great feeling of responsibility among the Danes when it comes to cleaning the oceans for plastic.

      The maritime industry also acknowledges the plastic waste problem in the ocean which led to a project by the organization Ocean Cleanup. It was launched in September 2018 and consists of a U-shaped floater that is 600 meters long and 3 meters deep. The floater is transported out on the ocean by a ship and then it will move with the help of waves and current. The plastic will get caught in the middle of the U-shaped floater and every 2 months a ship will come and collect the plastic, bring it back to shore, and then recycle it. The pilot project was launched in co-operation with Maersk Supply Services who transported the first floater 2200 km outside the coast of San Francisco and then monitored the floater for 2 months. Maersk is also supporting the project with 10 million DKK and contributes a lot to the plastic waste agenda.

      The aim is to remove 90% of all the ocean plastic by 2040 and The Ocean Cleanup’s long-term ambition is to install at least 60 systems to remove 50% of the 80,000 tonnes of plastic in the Great Pacific Garbage Patch within five years. The Great Pacific Garbage Patch is the largest accumulation of ocean plastic in the world and is located between Hawaii and California.

      The global flow of plastic 2016 (source: McKinsey)

      Another initiative was launched in 2017 when several Danish organizations, companies, and research institutions created a partnership called the Ocean Plastic Forum. The purpose of the partnership is to gather different plastic litter contractors and partners in the solving of small as well as large turnkey projects. The Ocean Plastic Forum was officially inaugurated last month at a kickoff meeting at the Danish Shipping’s office in Copenhagen.

      So, there are several projects and initiatives going on at the moment that are focusing on and contributing to cleaning up the plastic waste in the oceans. Even though a lot is being done both in Denmark and internationally, we still have a long way to go before the oceans are completely clean and free of plastic waste. The shipping companies, governments, and the general public need to address the problem in every way in order to reach the EU’s target for recycling plastic packaging which is 55% by 2030. Denmark currently achieves less than a third of this and according to the report by McKinsey, a first step to reaching it can be for municipalities to align their criteria for collecting waste in order to eliminate today’s inefficiency.

      Read more at www.re-flow.io

      Untitled-4-1-0ac9fe69

      Need to ship something? Your choice of transport affects everybody

      It’s time to consider the environmental impact of spare parts transportation. 

      There is a difference of over 4,000% in emissions between the most and the least polluting way of transporting cargo.

      Transport represents one of the most polluting sectors and it is responsible for almost 25% of global greenhouse gas emissions. GHG emissions from the sector have more than doubled since 1970, reaching almost 7 Gigatonnes CO2 equivalent, and freight counts as 17% of it. According to the latest IPCC (the Intergovernmental Panel for climate change) report, the amount of transport emissions is destinated to increase in the next decades due to the growth of freight activities. In fact, despite the introduction of more efficient means of transportation and new policies, an increase in GHG emissions has still been observed because there has been an increase in general consumption.

      A greenhouse gas is a gas that absorbs and traps heat in the atmosphere contributing to the greenhouse effect. The greenhouse effect is a natural process that has been altered by human activities in the last decades causing an increase of about 1.0°C of average global temperature compared to pre-industrial levels. The principal contributors of CO2 produced by human activities come from the combustion of fossil fuels where the energy, transportation, and industry sectors are the main emitters.

       
      Globalization facilitated the process of sending goods all over the world and the decrease in the cost of shipping it. However, the sector has a conspicuous environmental impact that we should consider. In fact, the choice of means of transport strongly influences the amount of CO2 emitted. So, what is the environmental impact of shipping goods?
      The amount in grams of CO2 released per ton of freight per km (www.re-flow.io)

      Air freight represents the most polluting means of transportation while rails and ships are the most “environmentally friendly”. Even though ships represents the less polluting system of transport it still contributes to about 2-3% of the total GHG emission which is an equivalent to 796 million tonnes a year. This amount of emissions is the same as Germany’s total CO2 pollution.

      The figure below shows an example of the carbon footprint of the transportation of 1 ton of cargo from Coral Springs in Miami, USA to Lyngby, Denmark. The calculation compares the variations in CO2 equivalent emission between land and air freight and land and water freight.

      Carbon footprint of the transportation of 1 ton of cargo from Coral Springs in Miami, USA to Lyngby, Denmark.

      As it is shown in the figure, the environmental impact is much smaller by transporting by land and sea because the total emissions decrease by 98% compared to transporting the same cargo by land and air.

      The road to commit to decreasing the environmental impact of the transport sector is long, but it starts with the companies taking action themselves. A behavioral change is necessary together with technological improvements. Rethinking business logistics, analyzing the supply chain structure and prioritization of sourcing locally instead of overseas can optimize the company’s transportation network and decrease its environmental impact. Another solution to consider would be to ship a spare part well in advance in order to avoid airfreight and to choose a less polluting way of transportation such as rail or shipping. Finally, better performance management and capacity optimization provided by digital platforms can also help to decrease environmental impacts caused by the companies.

      Read more at www.re-flow.io

      winner-scaled-8f184d01

      Winner of SDG Tech Awards 2019

      ReFlow announced the Winner of SDG Tech Awards 2019

      About SDG Tech Awards:
      “The ultimate celebration of sustainable technology in Denmark” this inspiring evening, hosted at IDA’s Respond Festival, boasted groundbreaking startups, large corporates, promising university research, and exciting NGOs. Together, we celebrated the winners of each category for their REAL WORK towards sustainability.

      It was a very proud founder that entered the stage during the award ceremony at the SDG Tech Awards when Reflow Maritime was announced as winners in the category for circular economy.

      The winner was selected from over 220 nominees by more than 30 expert judges from institutions like: STANFORD, DTU, UNICEF, UNDP, DI, VÆKSTFONDEN, ISS and DELL.

      “We are do overwhelmed by the response we have received by winning this award – we are on a journey to facilitate a more sustainable maritime industry. We hope that this award will assist us in underlining the importance of the role that circular economy play in this” states Rasmus Elsborg-Jensen, Founder of ReFlow Maritime.

      View the award ceremony here: