As we transition to a greener future, it’s essential to look at the full picture when assessing the environmental impact of products, vessels, and their energy sources.
As we transition to a greener future, it’s essential to look at the full picture when assessing the environmental impact of products, vessels, and their energy sources.
We’ve previously talked about The Corporate Sustainability Reporting Directive (CSRD), which is new EU regulation that aims to increase corporate transparency and accountability in relation to sustainability. In this article we’ll discuss the directive’s importance to the maritime industry.
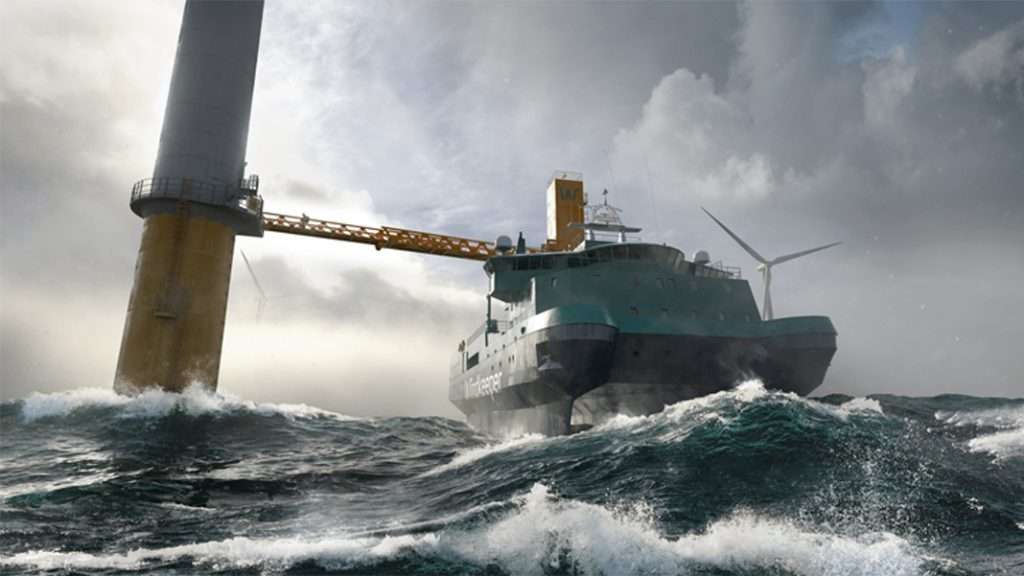
In a transformative move for the maritime industry, ReFlow has signed a landmark agreement with GC Rieber Shipping, the renowned Norwegian shipping company. The partnership aims to establish a first-of-its-kind Life Cycle Assessment ( LCA ) model for the Windkeeper, GC Rieber Shipping’s pioneering vessel. This groundbreaking initiative not only underscores the centrality of LCA and climate data in promoting sustainability but also sets a new precedent for the shipping industry.

In a recent announcement, Rasmus Elsborg Jensen, the CEO of ReFlow, has been selected to serve as an EU Climate Pact Ambassador for a second term. Reflecting his unparalleled commitment to environmental sustainability, this decision reflects both the success of his previous tenure and the expectations for continued leadership in this pivotal role.
Life Cycle Assessment (LCA) and product carbon footprint reporting are essential tools for organizations looking to measure and reduce their environmental impact. However, the validity and reliability of these reports are critical to their effectiveness. To ensure transparency and accuracy, third-party verification is essential.
ReFlow is featured i VIKING’s newest sustainabvility report as key digital decarbonization collaborator. For VIKING sustainability isn’t just buzzword. They have ambitious net zero goals and are transparent about how they plan to reach them. The role ReFlow have had in their digital decarbonization is highlighted in their newest sustainability report.
A new EU directive (CSRD) will tighten the reporting requirement on emissions for companies
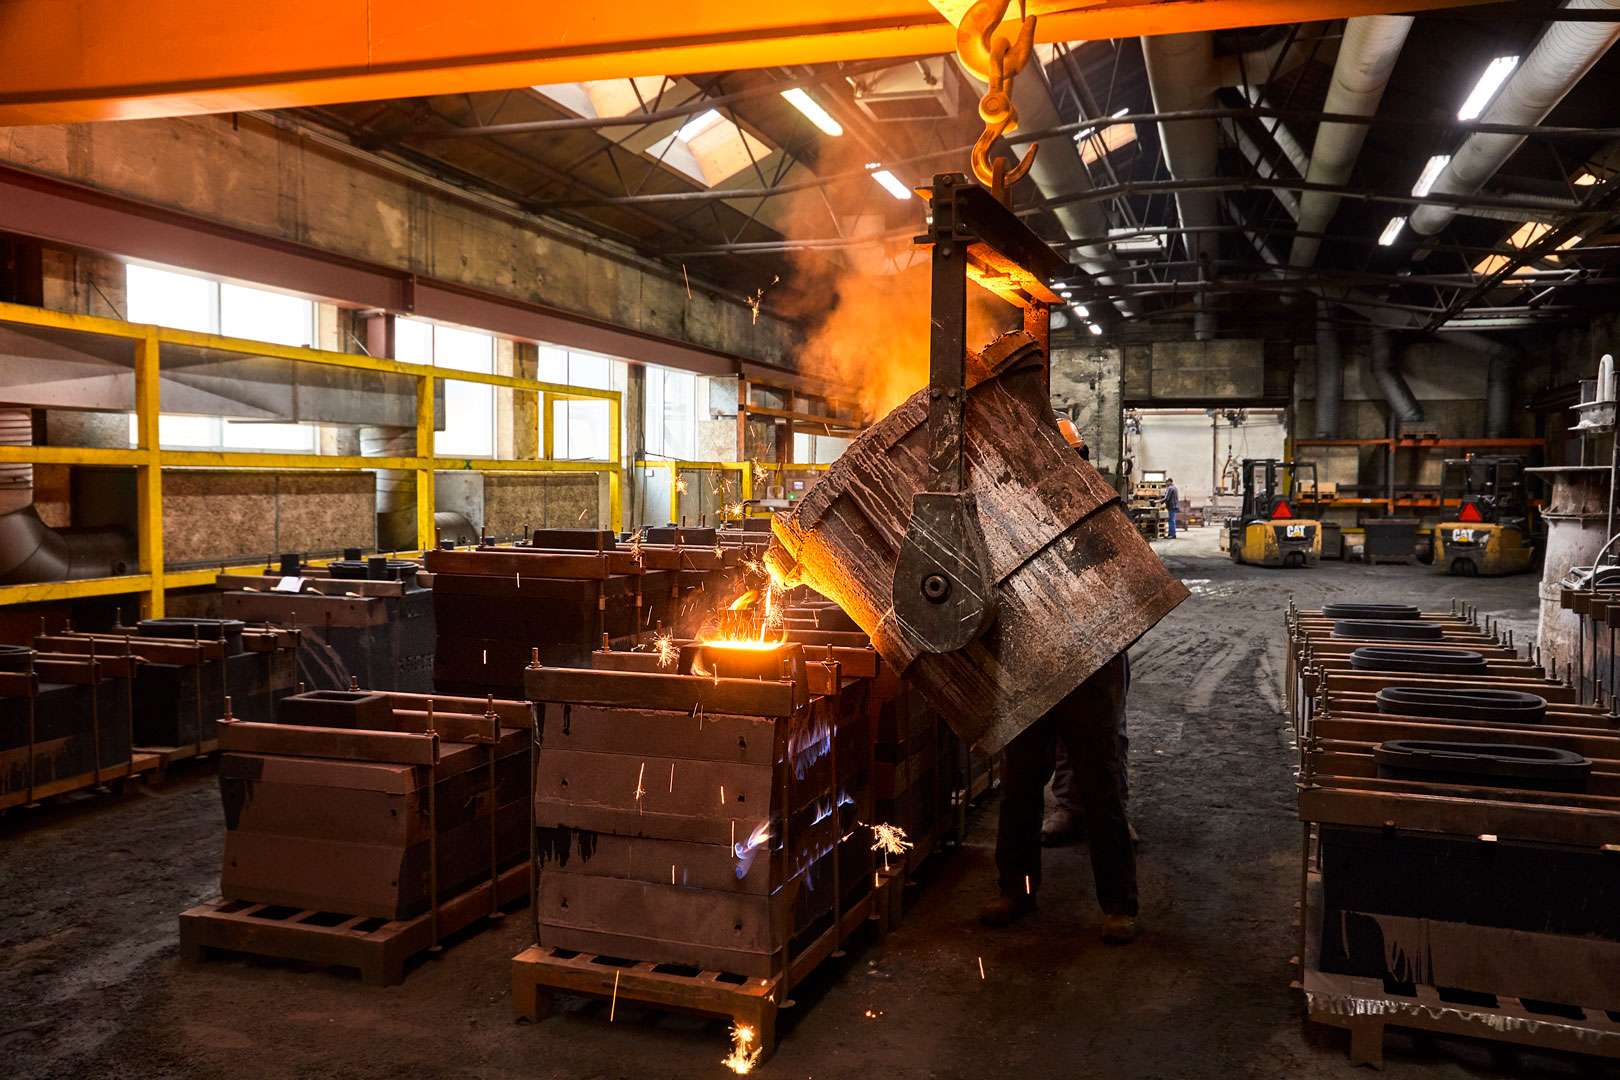
One of Europe’s largest foundry groups has chosen ReFlow as decarbonization partner

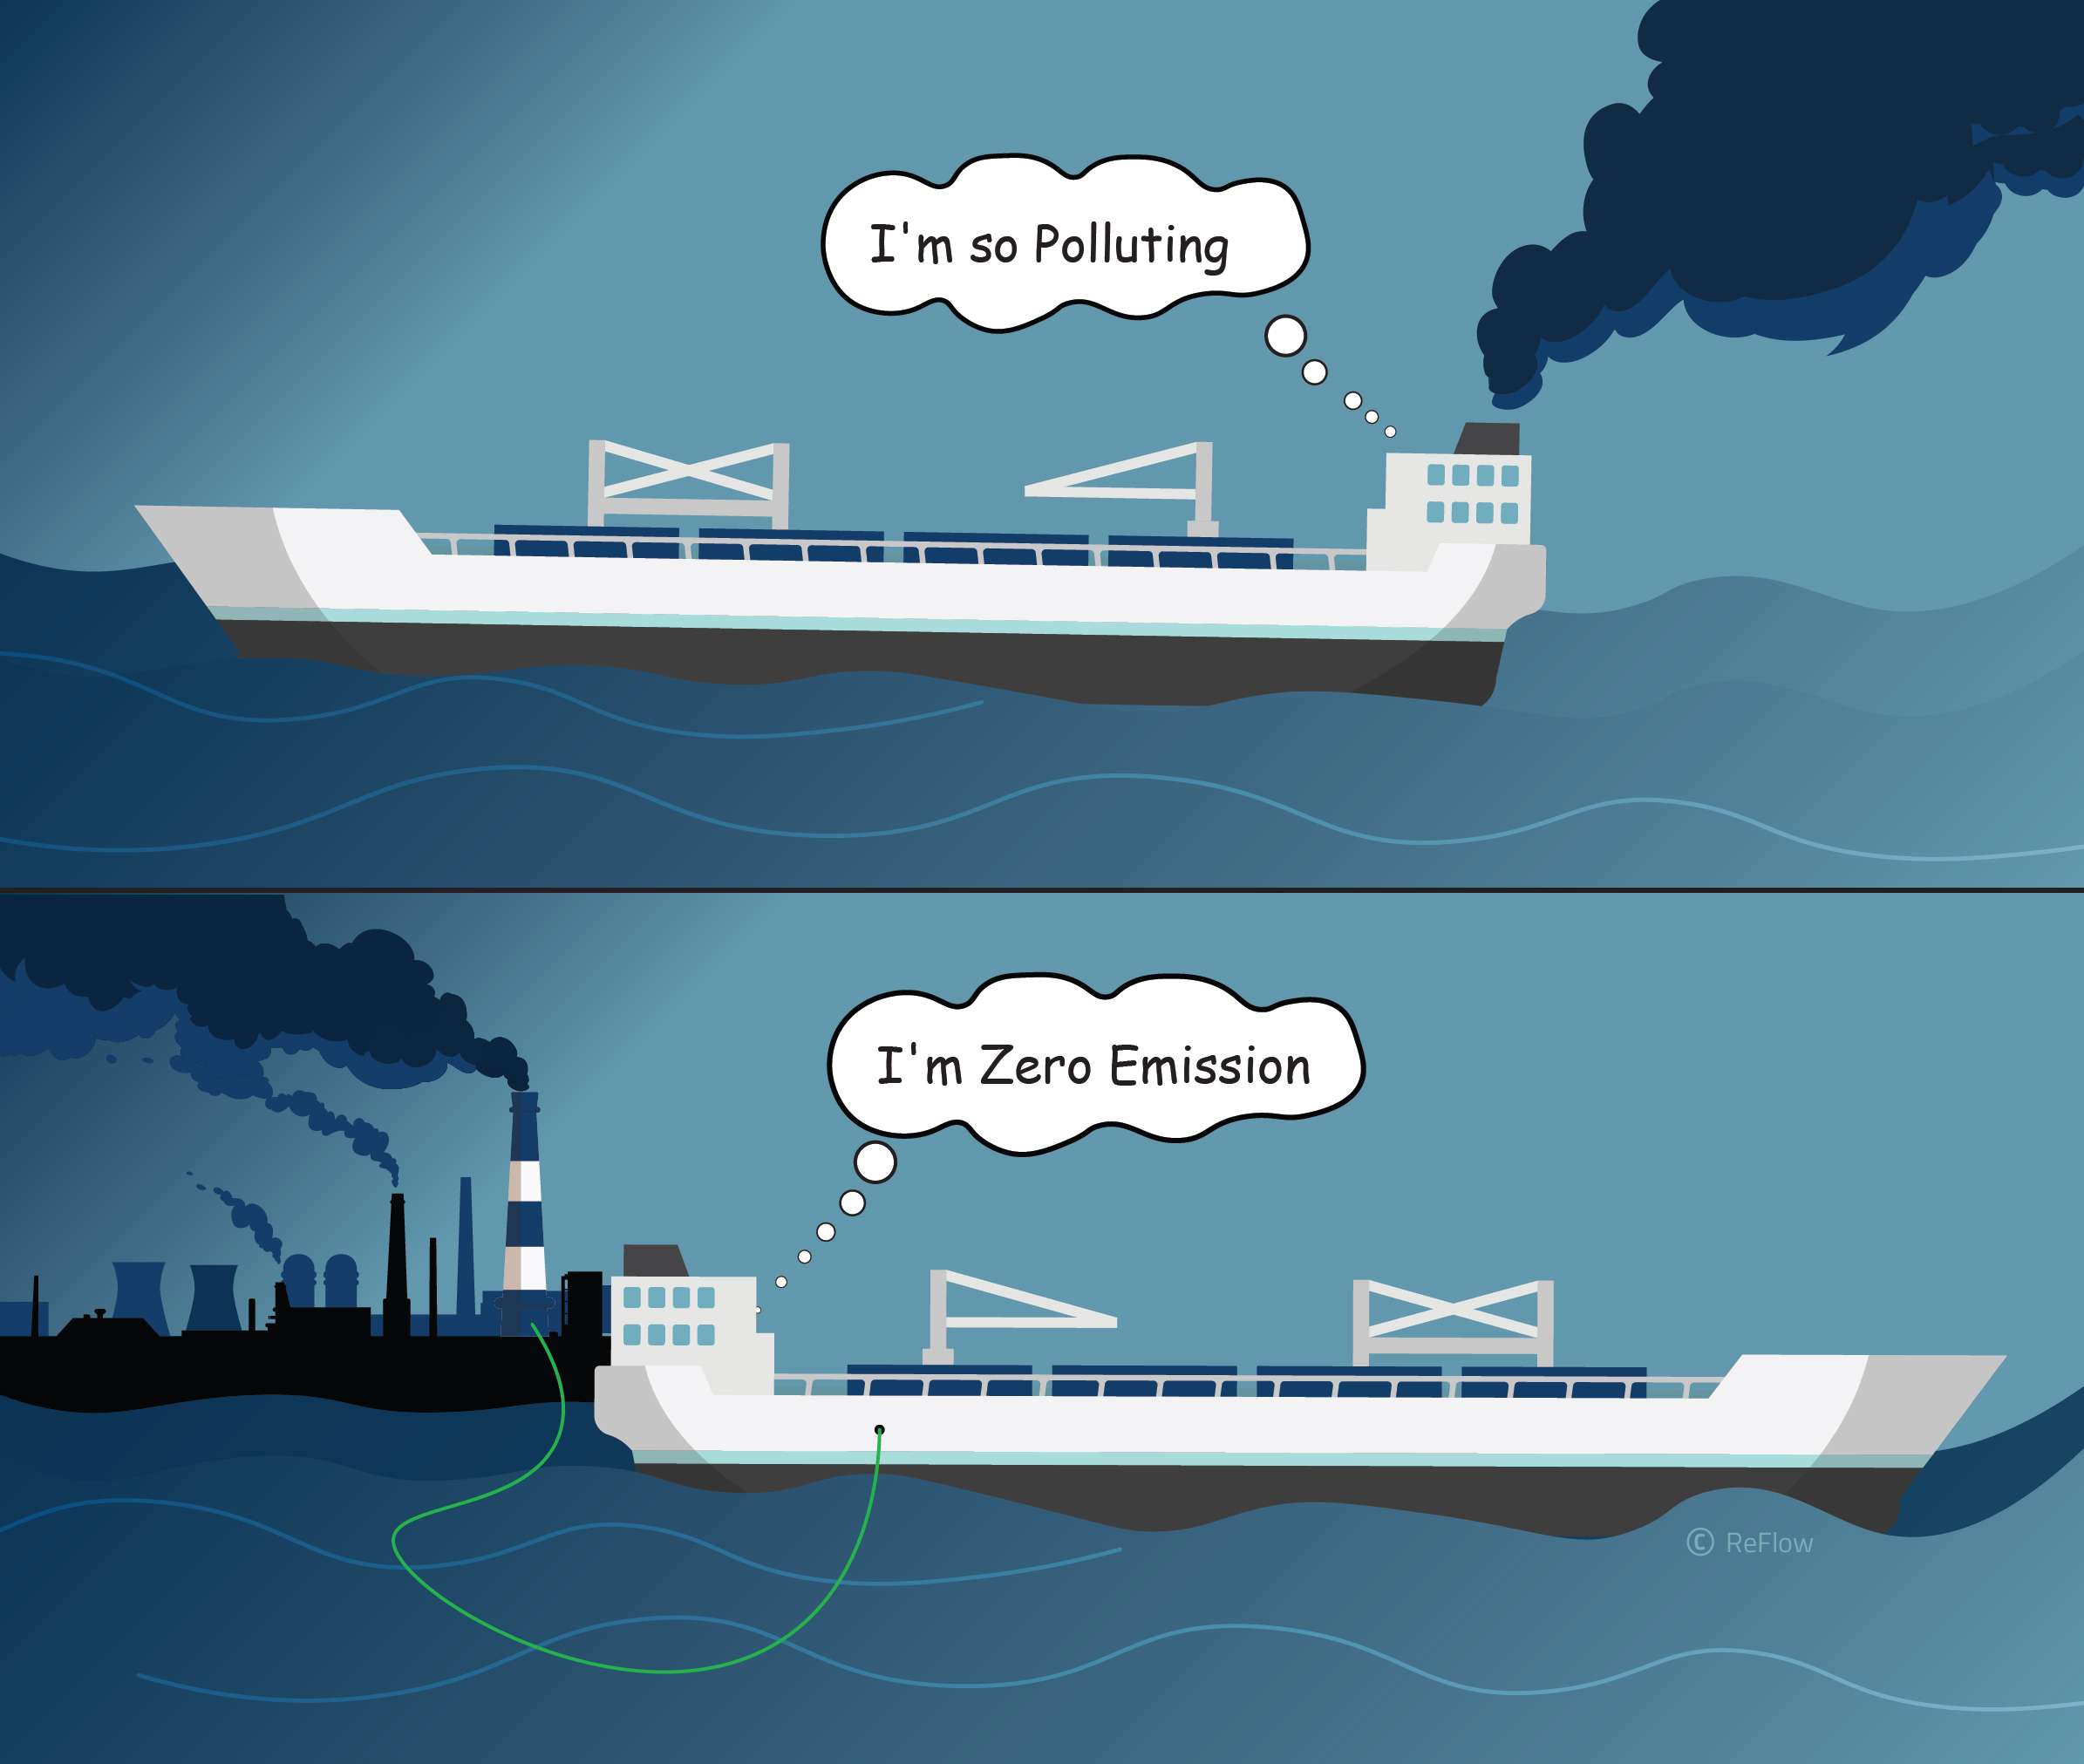
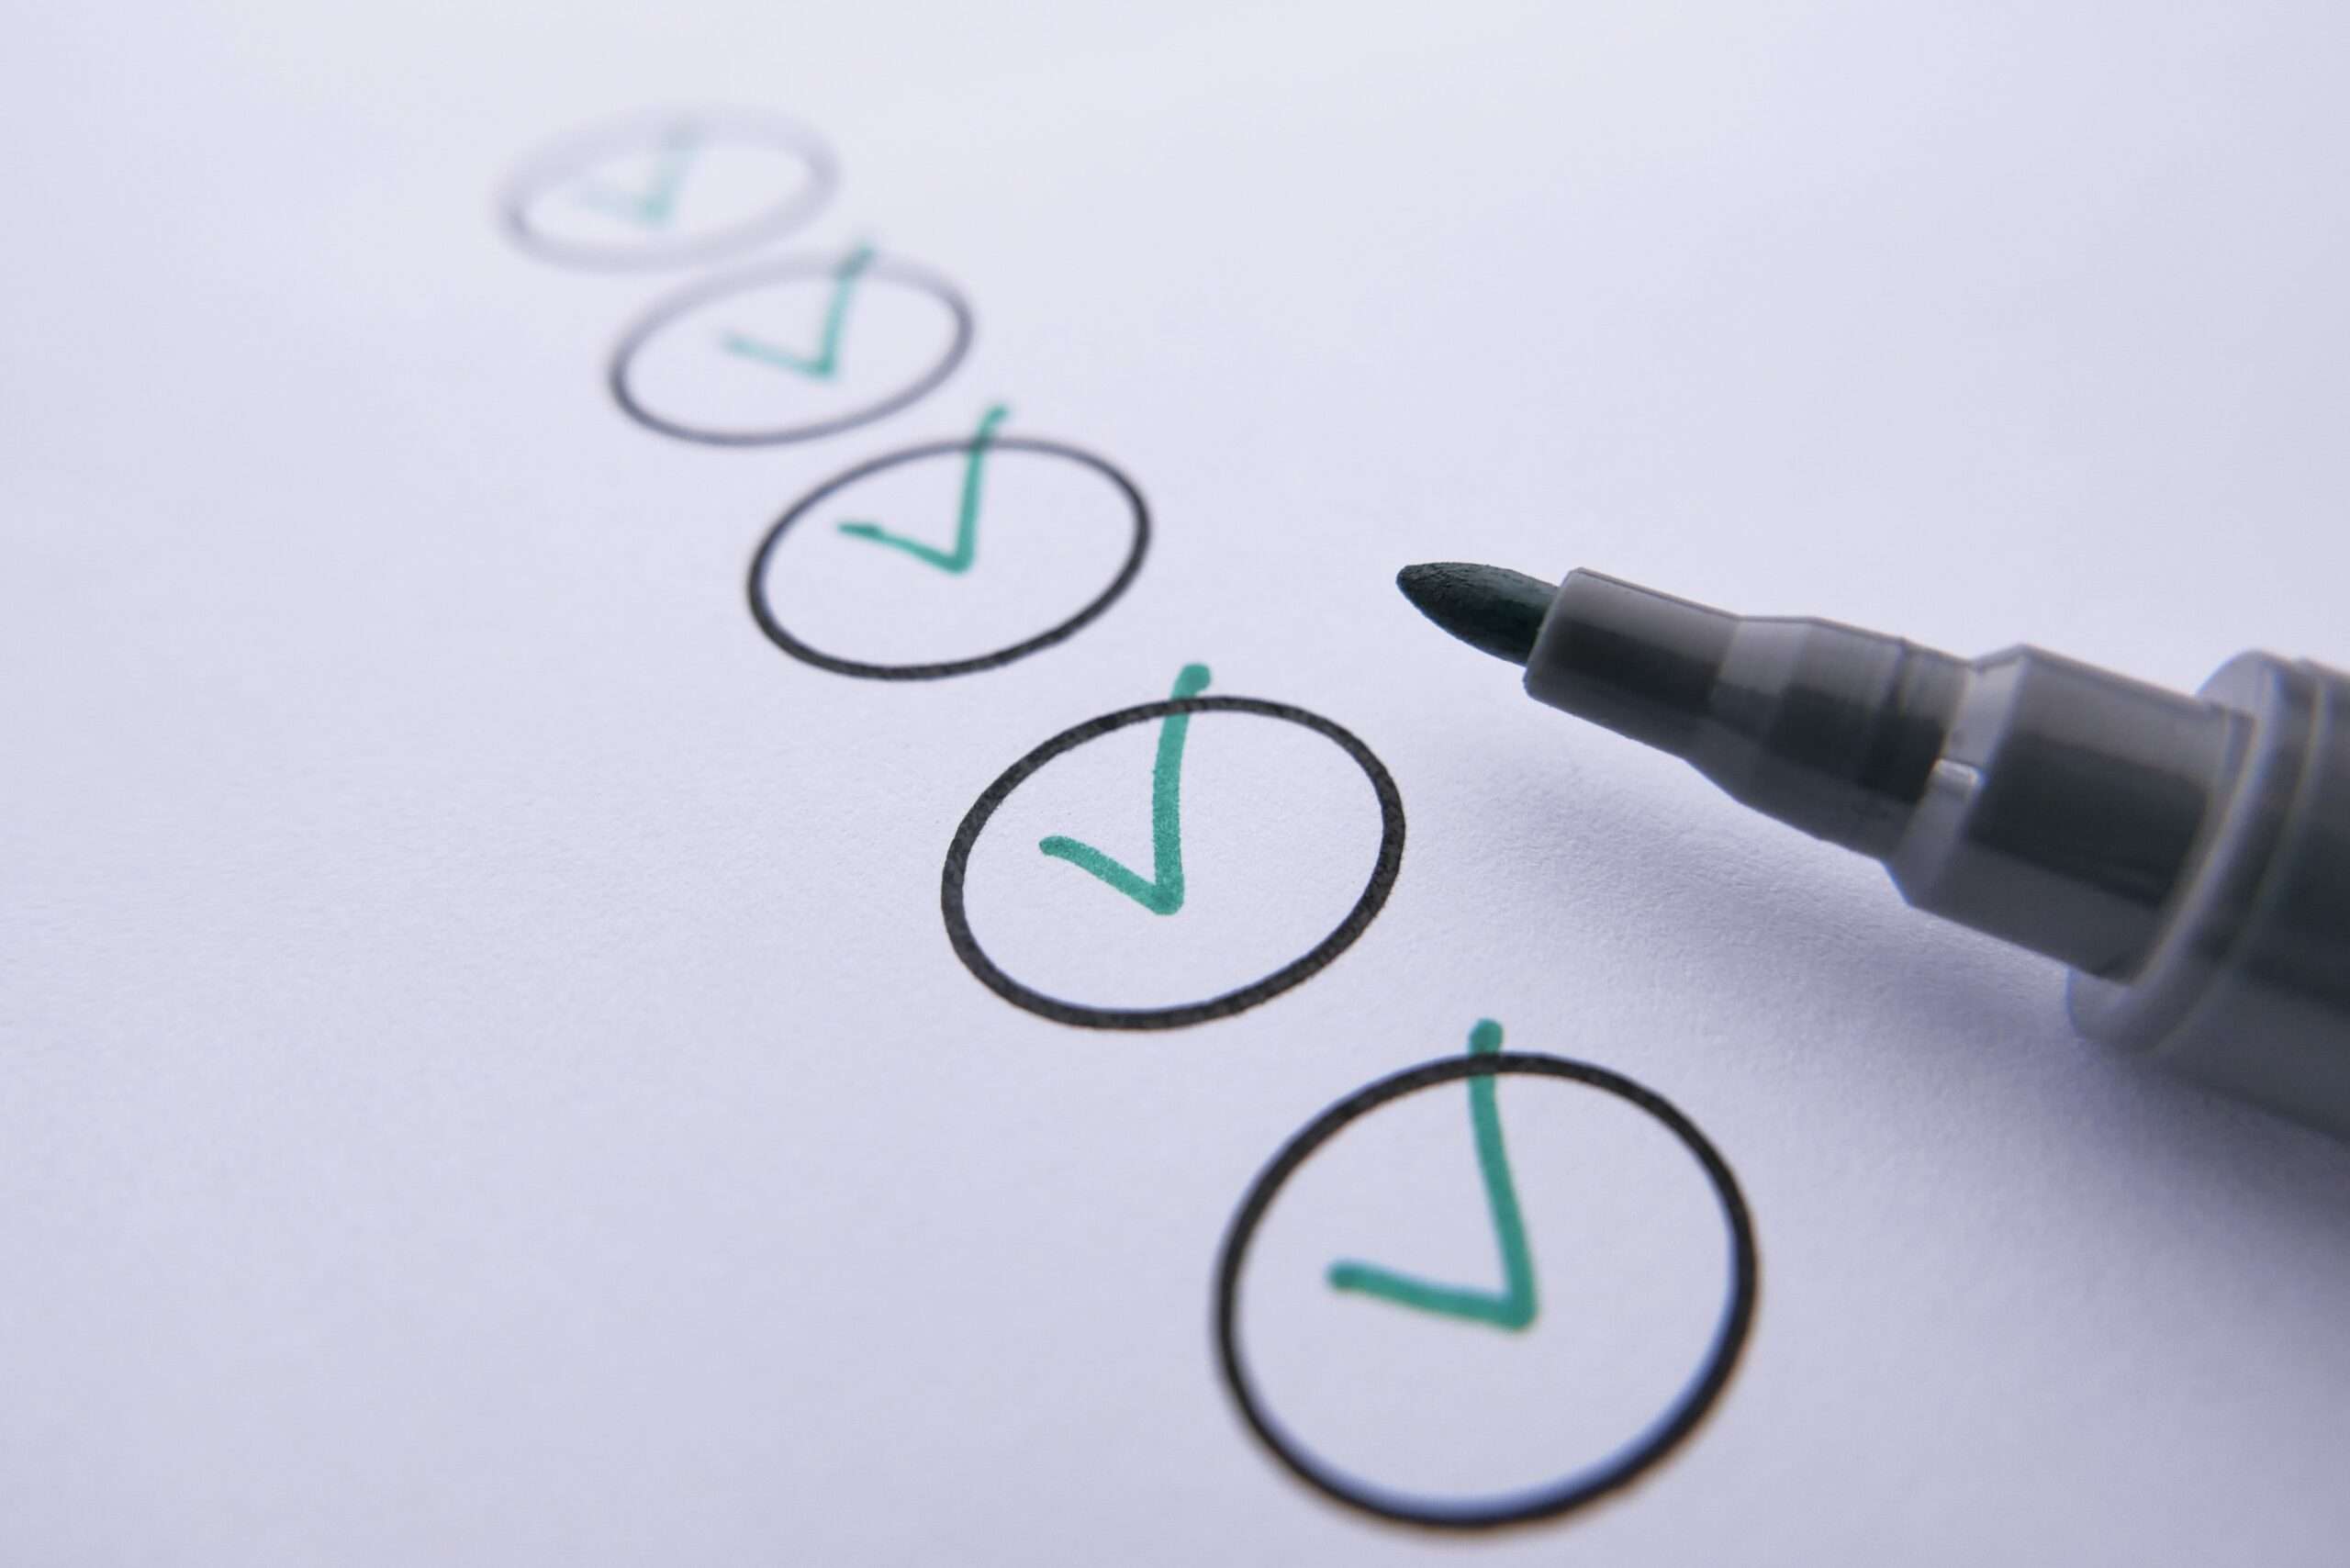
Have you ever questioned what makes a product zero-emission? If so, we’re here to shed some light on what can often be confusing to those beginning their journey towards calculating their emissions. Throughout this article, we attempt to provide some clarity on the differences between emissions classifications and provide insight into why oftentimes calling your products ‘zero emissions’ can be misleading to stakeholders and consumers.
Greenhouse gas emissions can be understood within the context of three scopes [1], namely scopes one, two, and three. Scope one is what we define as direct emissions. Direct emissions constitute the most well-known and classic example of fuel combustion such as everything that comes out of an exhaust pipe or chimney and enters the atmosphere directly.
Scope two consists of indirect emissions and can be understood through the eyes of company consumption and other actions. An excellent example of this would be energy consumption. If a company utilizes a production line that demands electricity or if they have systems requiring heating or cooling this would fall into what we define as scope two.
Scope one and two have had their fair share of attention and reporting for the many past years. However, recently scope three has overtaken interest within environmental circles, and for good reason.
Scope three can be trickier to understand and assess. Actions that fall into scope three can often possess some of the highest amounts of atmospheric emissions and in some cases, more emissions can be expelled from actions in scope three, than from scope one and two combined. To break it down, scope three is defined as indirect emissions, just like that of scope two. Although, scope three is different in that it encompasses the indirect emissions related to activities throughout a company’s supply chain.
Essentially all emissions related to the upstream and downstream supply chain fall into scope 3 and include, but are not limited to, emissions from raw material extraction, transportation, and even infrastructure. These actions can be difficult to account for, however, they are necessary in order to fully understand emission outputs in their entirety. This is possible with life cycle assessments.
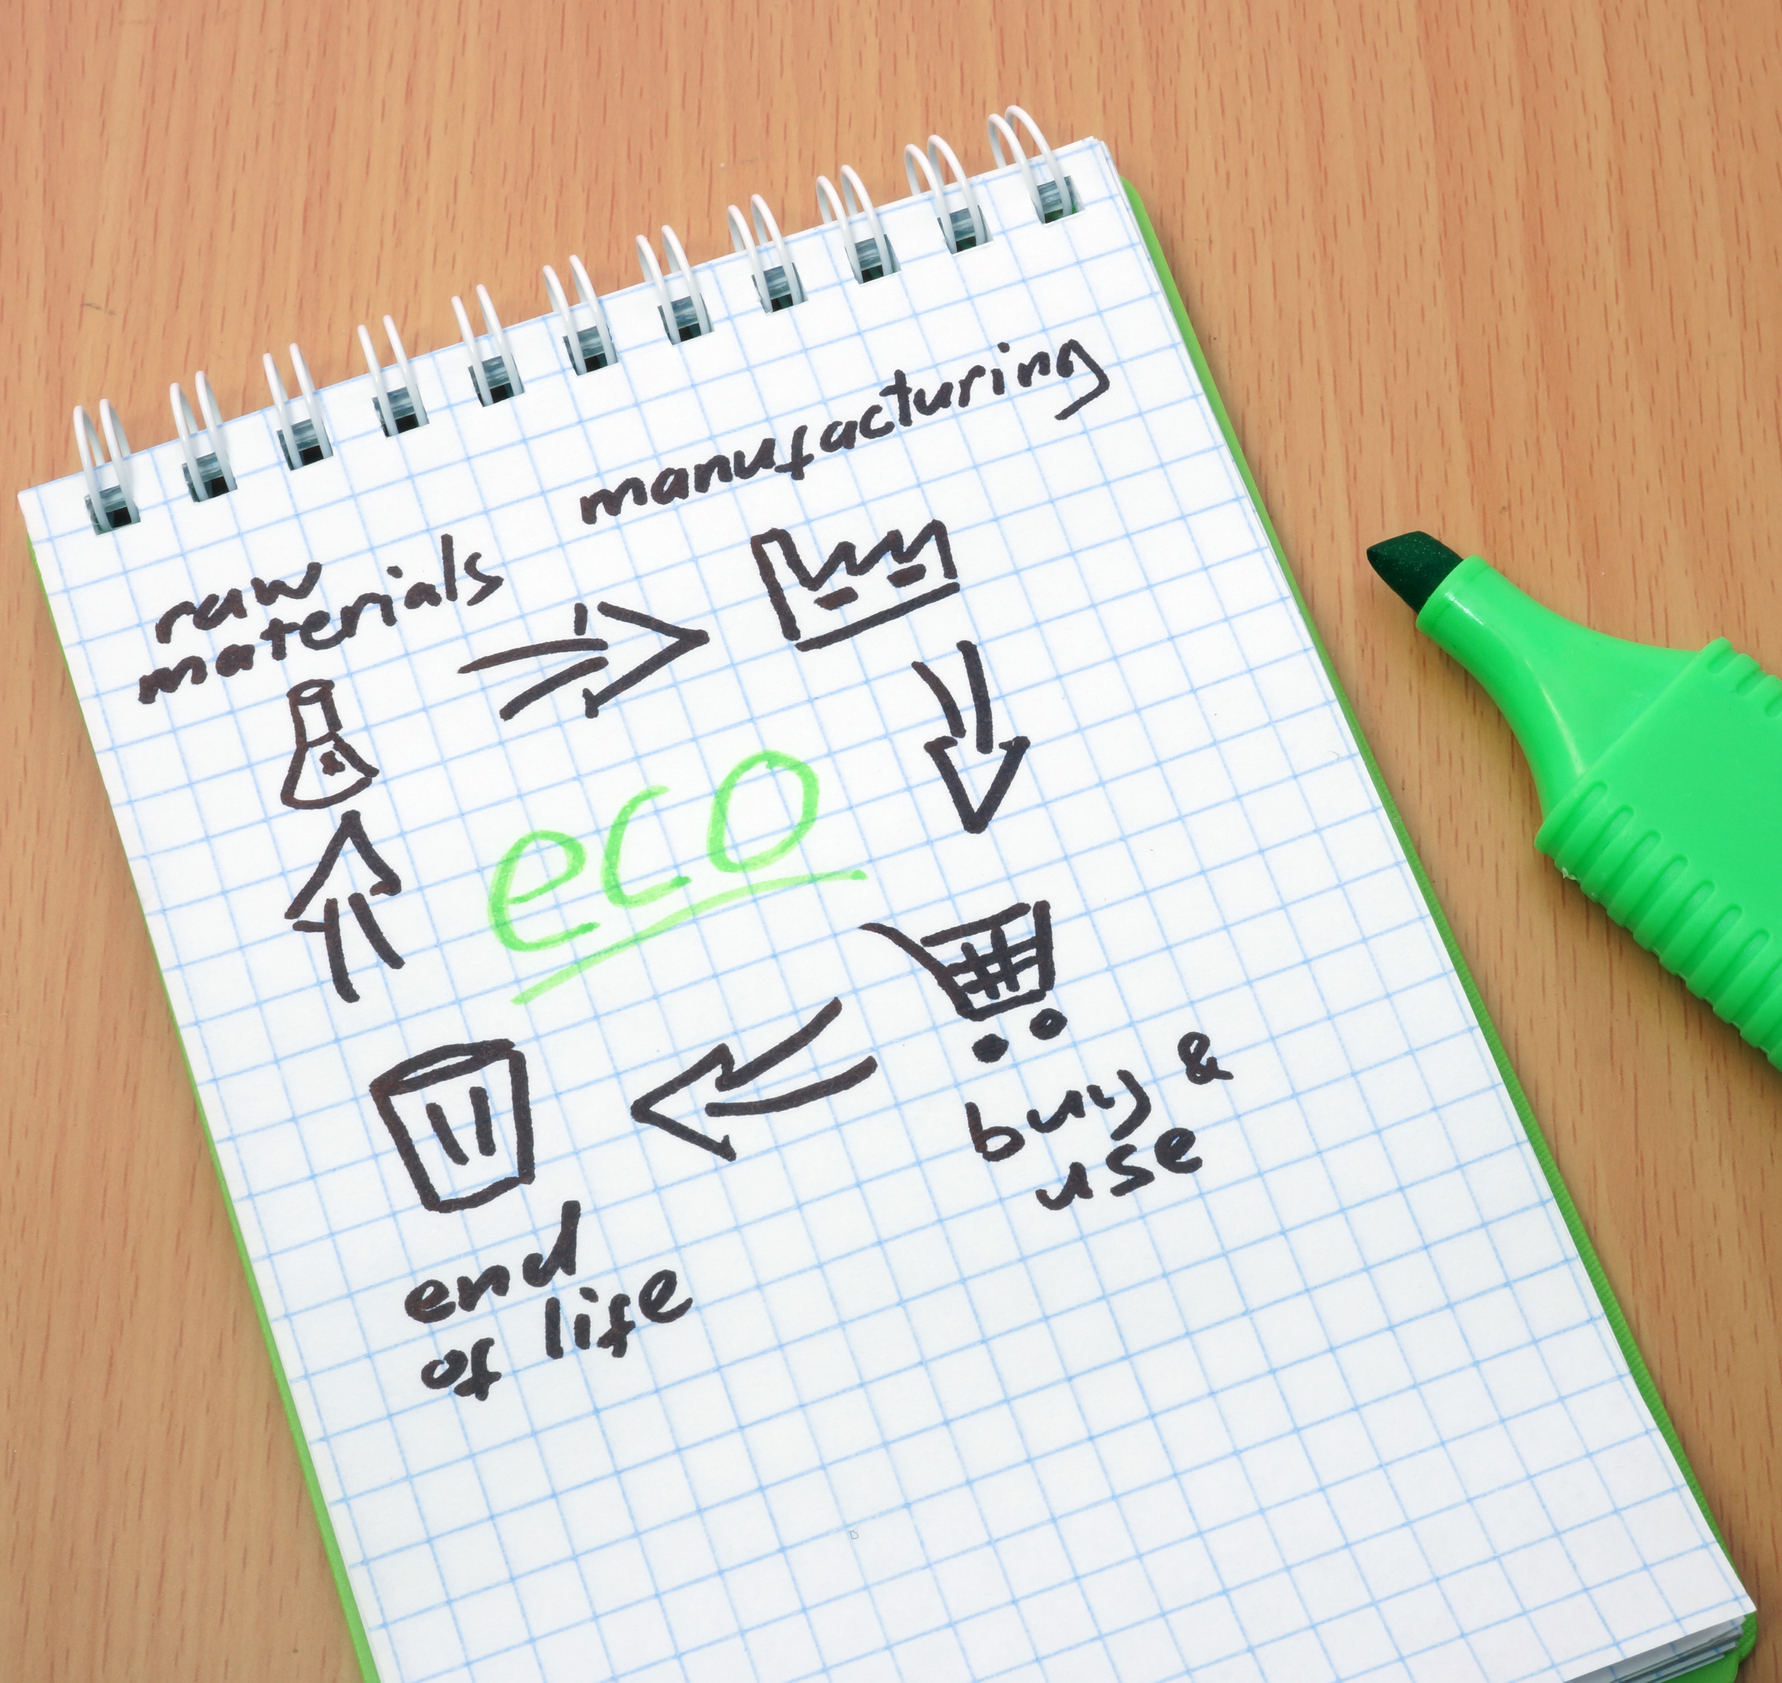
The only zero-emissions product is a product that reports on all scopes of emissions–including scope 3. ‘Zero-emissions’ products are everywhere. Although, in order to fully claim a product has zero-emissions qualities a Life Cycle Assessment (LCA) must be conducted where the scope one, two, and three emissions are accounted for. Unfortunately, this isn’t common practice for many companies making sustainable product claims.
Irresponsible burden-shifting can mean that different activities with different emissions outputs end up being weighed equally and can therefore result in greenwashing. For this reason, assessing a product from cradle to grave, or from the point of raw material extraction for the product’s creation, all the way up until the complete disposal of the product is instrumental in making honest claims about the product’s entire output of emissions. Governing bodies are currently regulating legislation to lower industry emissions where documentation and reporting for scope 3 are on the horizon. This is pushing many companies into taking these as signs to become fast movers and engage in early reporting.
Selling a product on the basis that it has zero emissions without first calculating the different impacts turns a blind eye to an essential part of holistically assessing the product. The first step toward creating a zero-emissions product is through creating a baseline of everything you know about the product. This is not easy work, but utilizing tools like Life Cycle Assessment (LCA) calculators is easily one of the best places to start.
Tools like life cycle assessments (LCAs) allow you to quantify products with both generic data and company-known data allowing for more in-depth and transparent reporting. Fortunately, extensive digital libraries are also available to make this data even more accessible to everyone.
From here it becomes easier to calculate the scope of emissions, see where hotspots are, and where attention is needed to get closer to a truly sustainable product. It’s safe to say, what would have been deemed impossible just 30 years ago has today become achievable through the use of these impact assessment tools [2].

European Commission. (28 January, 2021). Screening of websites for ‘greenwashing’: half of green claims lack evidence. Retrieved on 28/12/2021 from https://ec.europa.eu/commission/presscorner/detail/en/ip_21_269
European Commission. (2021). Consumer policy – strengthening the role of consumers in the green transition. Retrieved on 10/06/2022 from https://ec.europa.eu/info/law/better-regulation/have-your-say/initiatives/12467-Consumer-policy-strengthening-the-role-of-consumers-in-the-green-transition_en
European Commission. (2021). Environmental performance of products & businesses – substantiating claims. Retrieved on 10/06/2022 from https://ec.europa.eu/info/law/better-regulation/have-your-say/initiatives/12511-Environmental-performance-of-products-&-businesses-substantiating-claims_en